Nuwakot Solar Power Plant: Design and Production Analysis
Overview
Nepal's Nuwakot district sits at elevations ranging from 400 m to over 2000 m in the central hills, a terrain that combines high annual solar irradiance with poor grid connectivity: load shedding of 8–12 hours per day was common at the time of this study, and transmission infrastructure to the national grid remained limited. This project addresses that energy deficit through a complete feasibility-to-design study for a grid-connected solar photovoltaic power plant sized to meet projected district demand, carried out using ETAP (Electrical Transient Analyzer Program) — the same power system simulation environment used by utilities and independent power producers for utility-scale project engineering.
The study spans three phases: resource and demand assessment, electrical design (PV array, inverter, transformer, and collection system), and power system analysis (load flow, short-circuit, and protection coordination). Each phase produces outputs directly analogous to those required in a professional feasibility report or a USAID/ADB project documentation package, making the project a credible simulation of utility-scale engineering practice.
Technical Approach
Demand-side data were assembled from Nepal Electricity Authority (NEA) district load records and census population projections, yielding a peak demand estimate and a representative daily load curve for Nuwakot. Solar irradiance data were sourced from NASA POWER and cross-checked against ground station measurements from a nearby meteorological post, producing monthly average Global Horizontal Irradiance (GHI) values across the 12-month production profile. PV array sizing used the peak-sun-hour method: annual energy requirement divided by system efficiency (accounting for inverter, wiring, soiling, and temperature derating) determined the required DC nameplate capacity, which was then distributed across parallel strings of series-connected modules to match inverter input voltage windows.
The single-line diagram was constructed in ETAP with explicit modeling of PV source buses, string combiner boxes, DC collection cables, central inverters, a step-up transformer (400 V / 33 kV), and the 33 kV feeder connecting to the NEA substation. Load flow analysis (Newton-Raphson method) was run for peak-generation / minimum-load and minimum-generation / peak-load scenarios to bound the range of bus voltages across the collection system, confirming all buses remained within ±5% of nominal — the NEA interconnection standard. Short-circuit analysis (IEC 60909 method) determined maximum and minimum fault currents at each bus, which directly set the symmetrical interrupting duties for circuit breakers and the pickup settings for overcurrent relays.
Protection coordination used time-current characteristic (TCC) curves in ETAP to confirm selectivity between the feeder relay at the NEA substation, the plant interconnection relay, and string-level fuses. Relay settings were adjusted iteratively until fault clearance times at every bus were under the IEC 61000-4-11 voltage sag immunity limits and anti-islanding protection responded within the IEEE 1547 required two-second window.
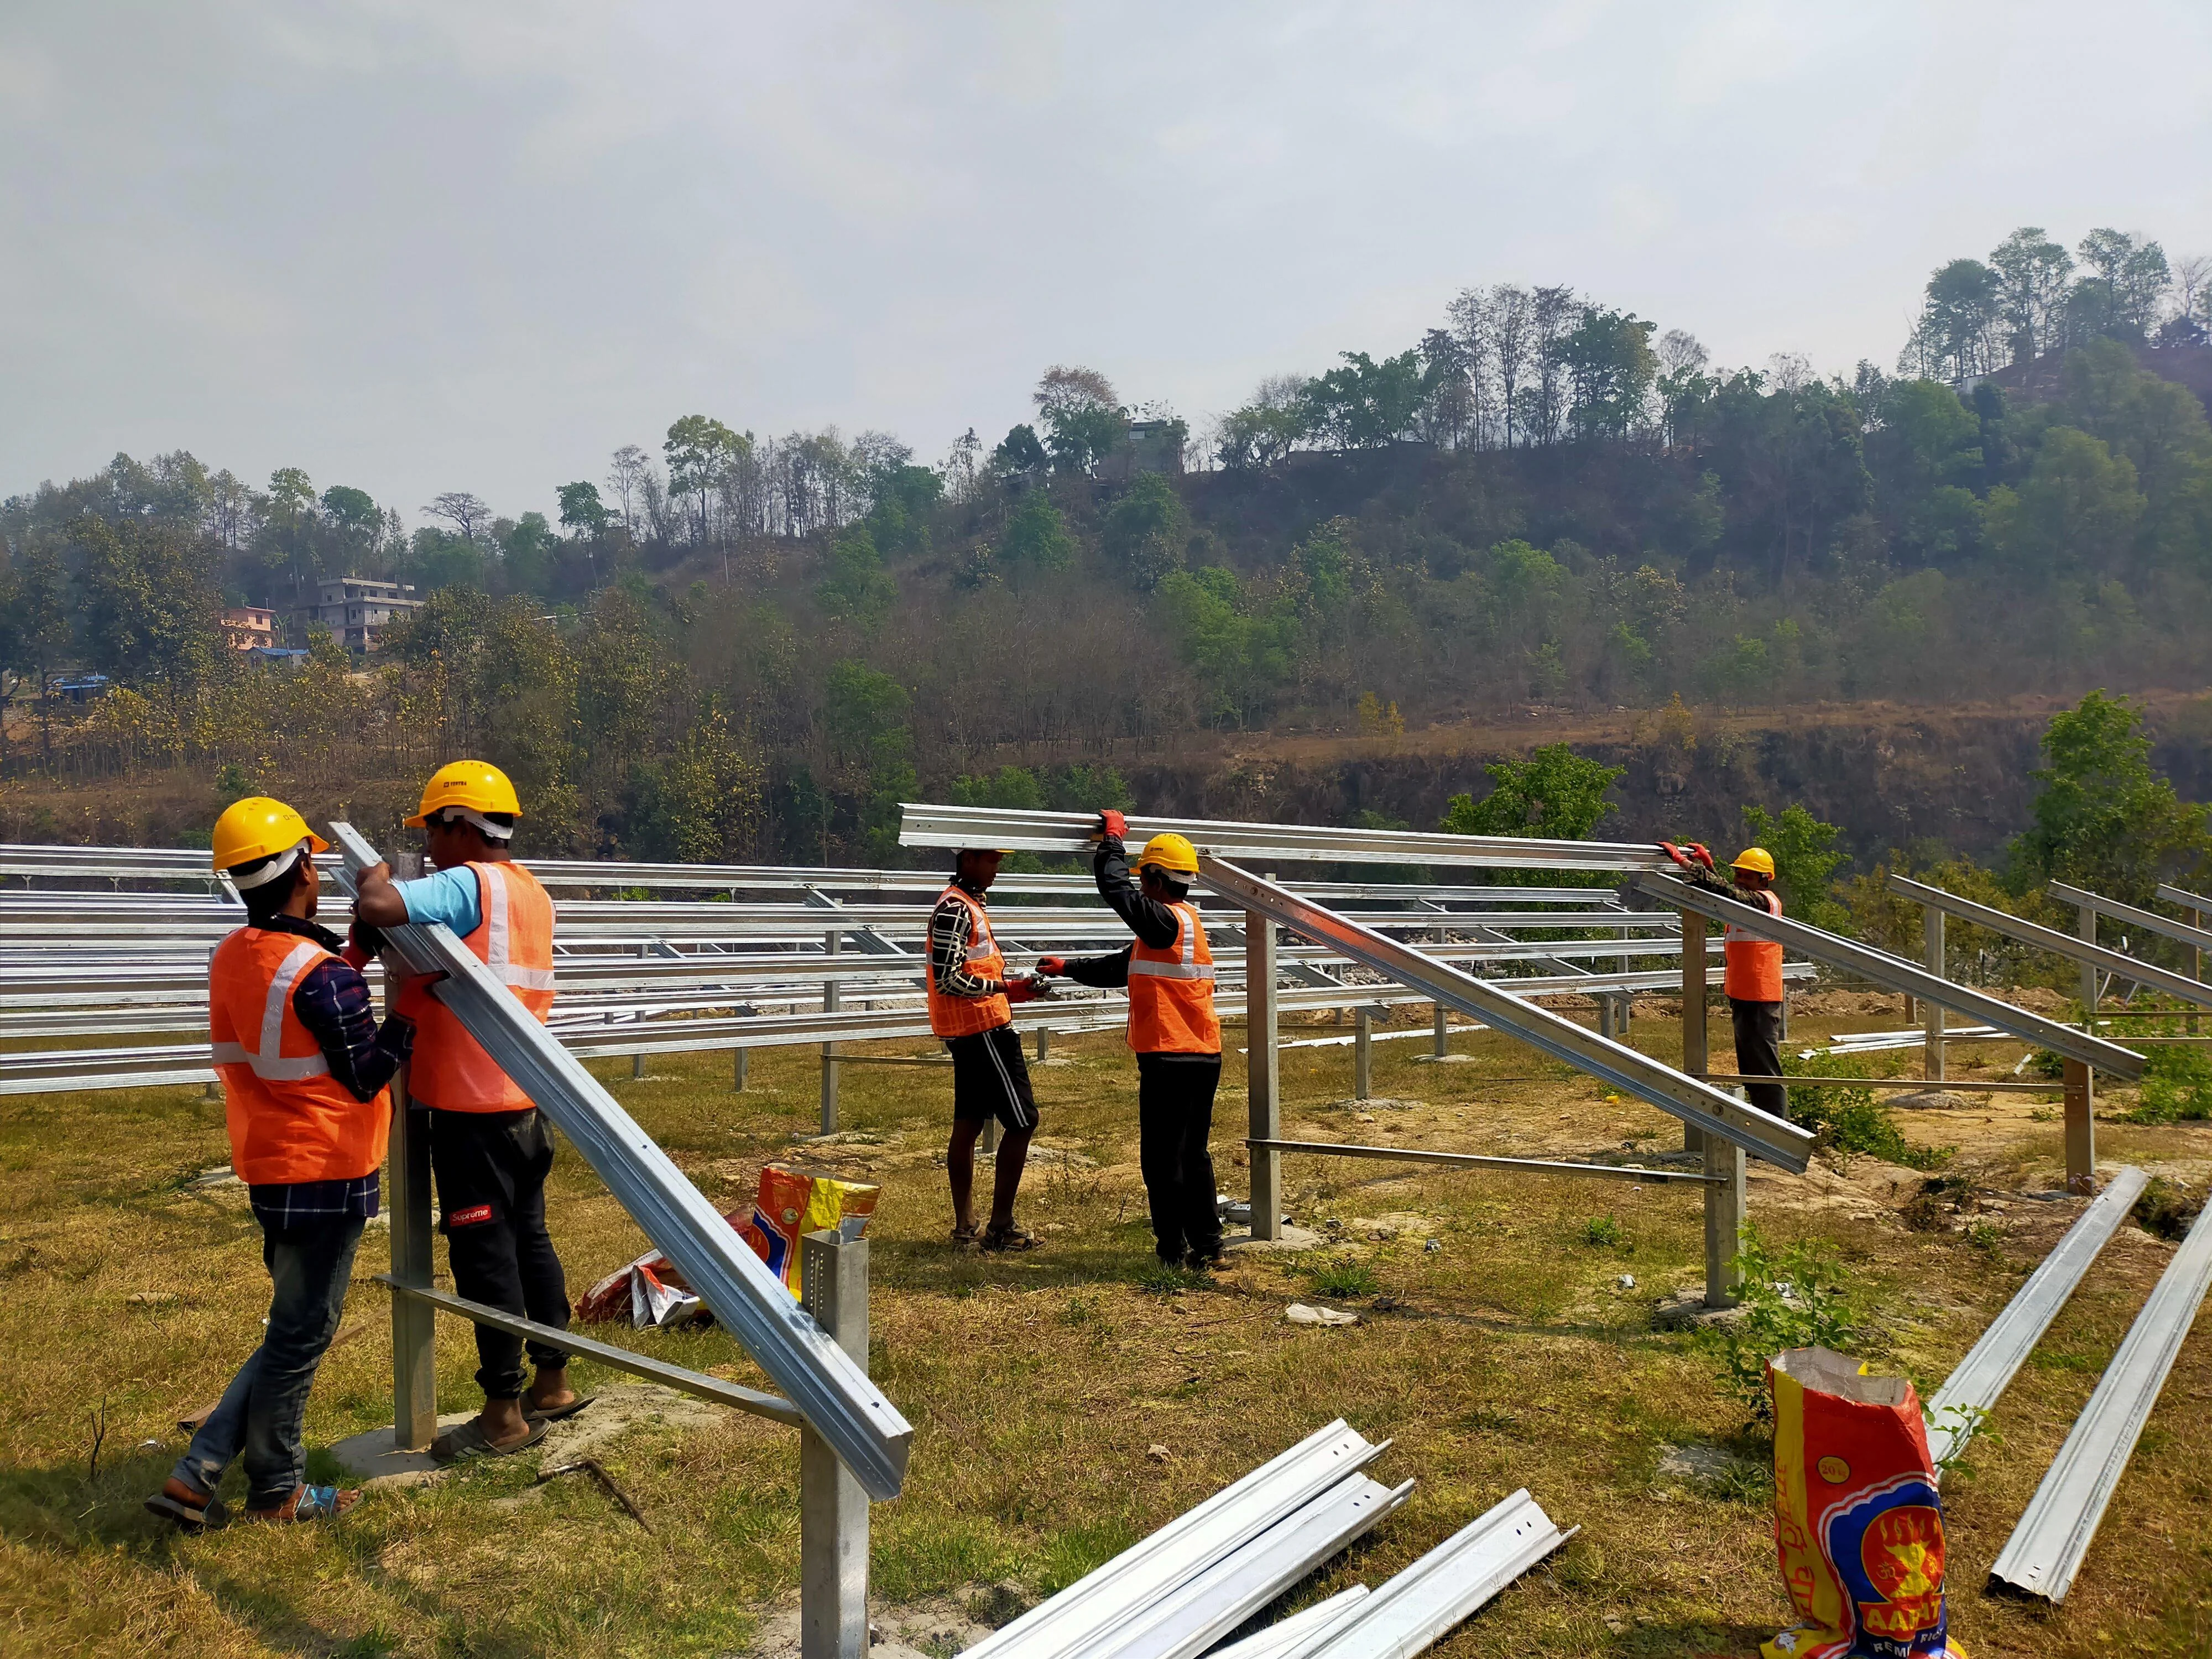
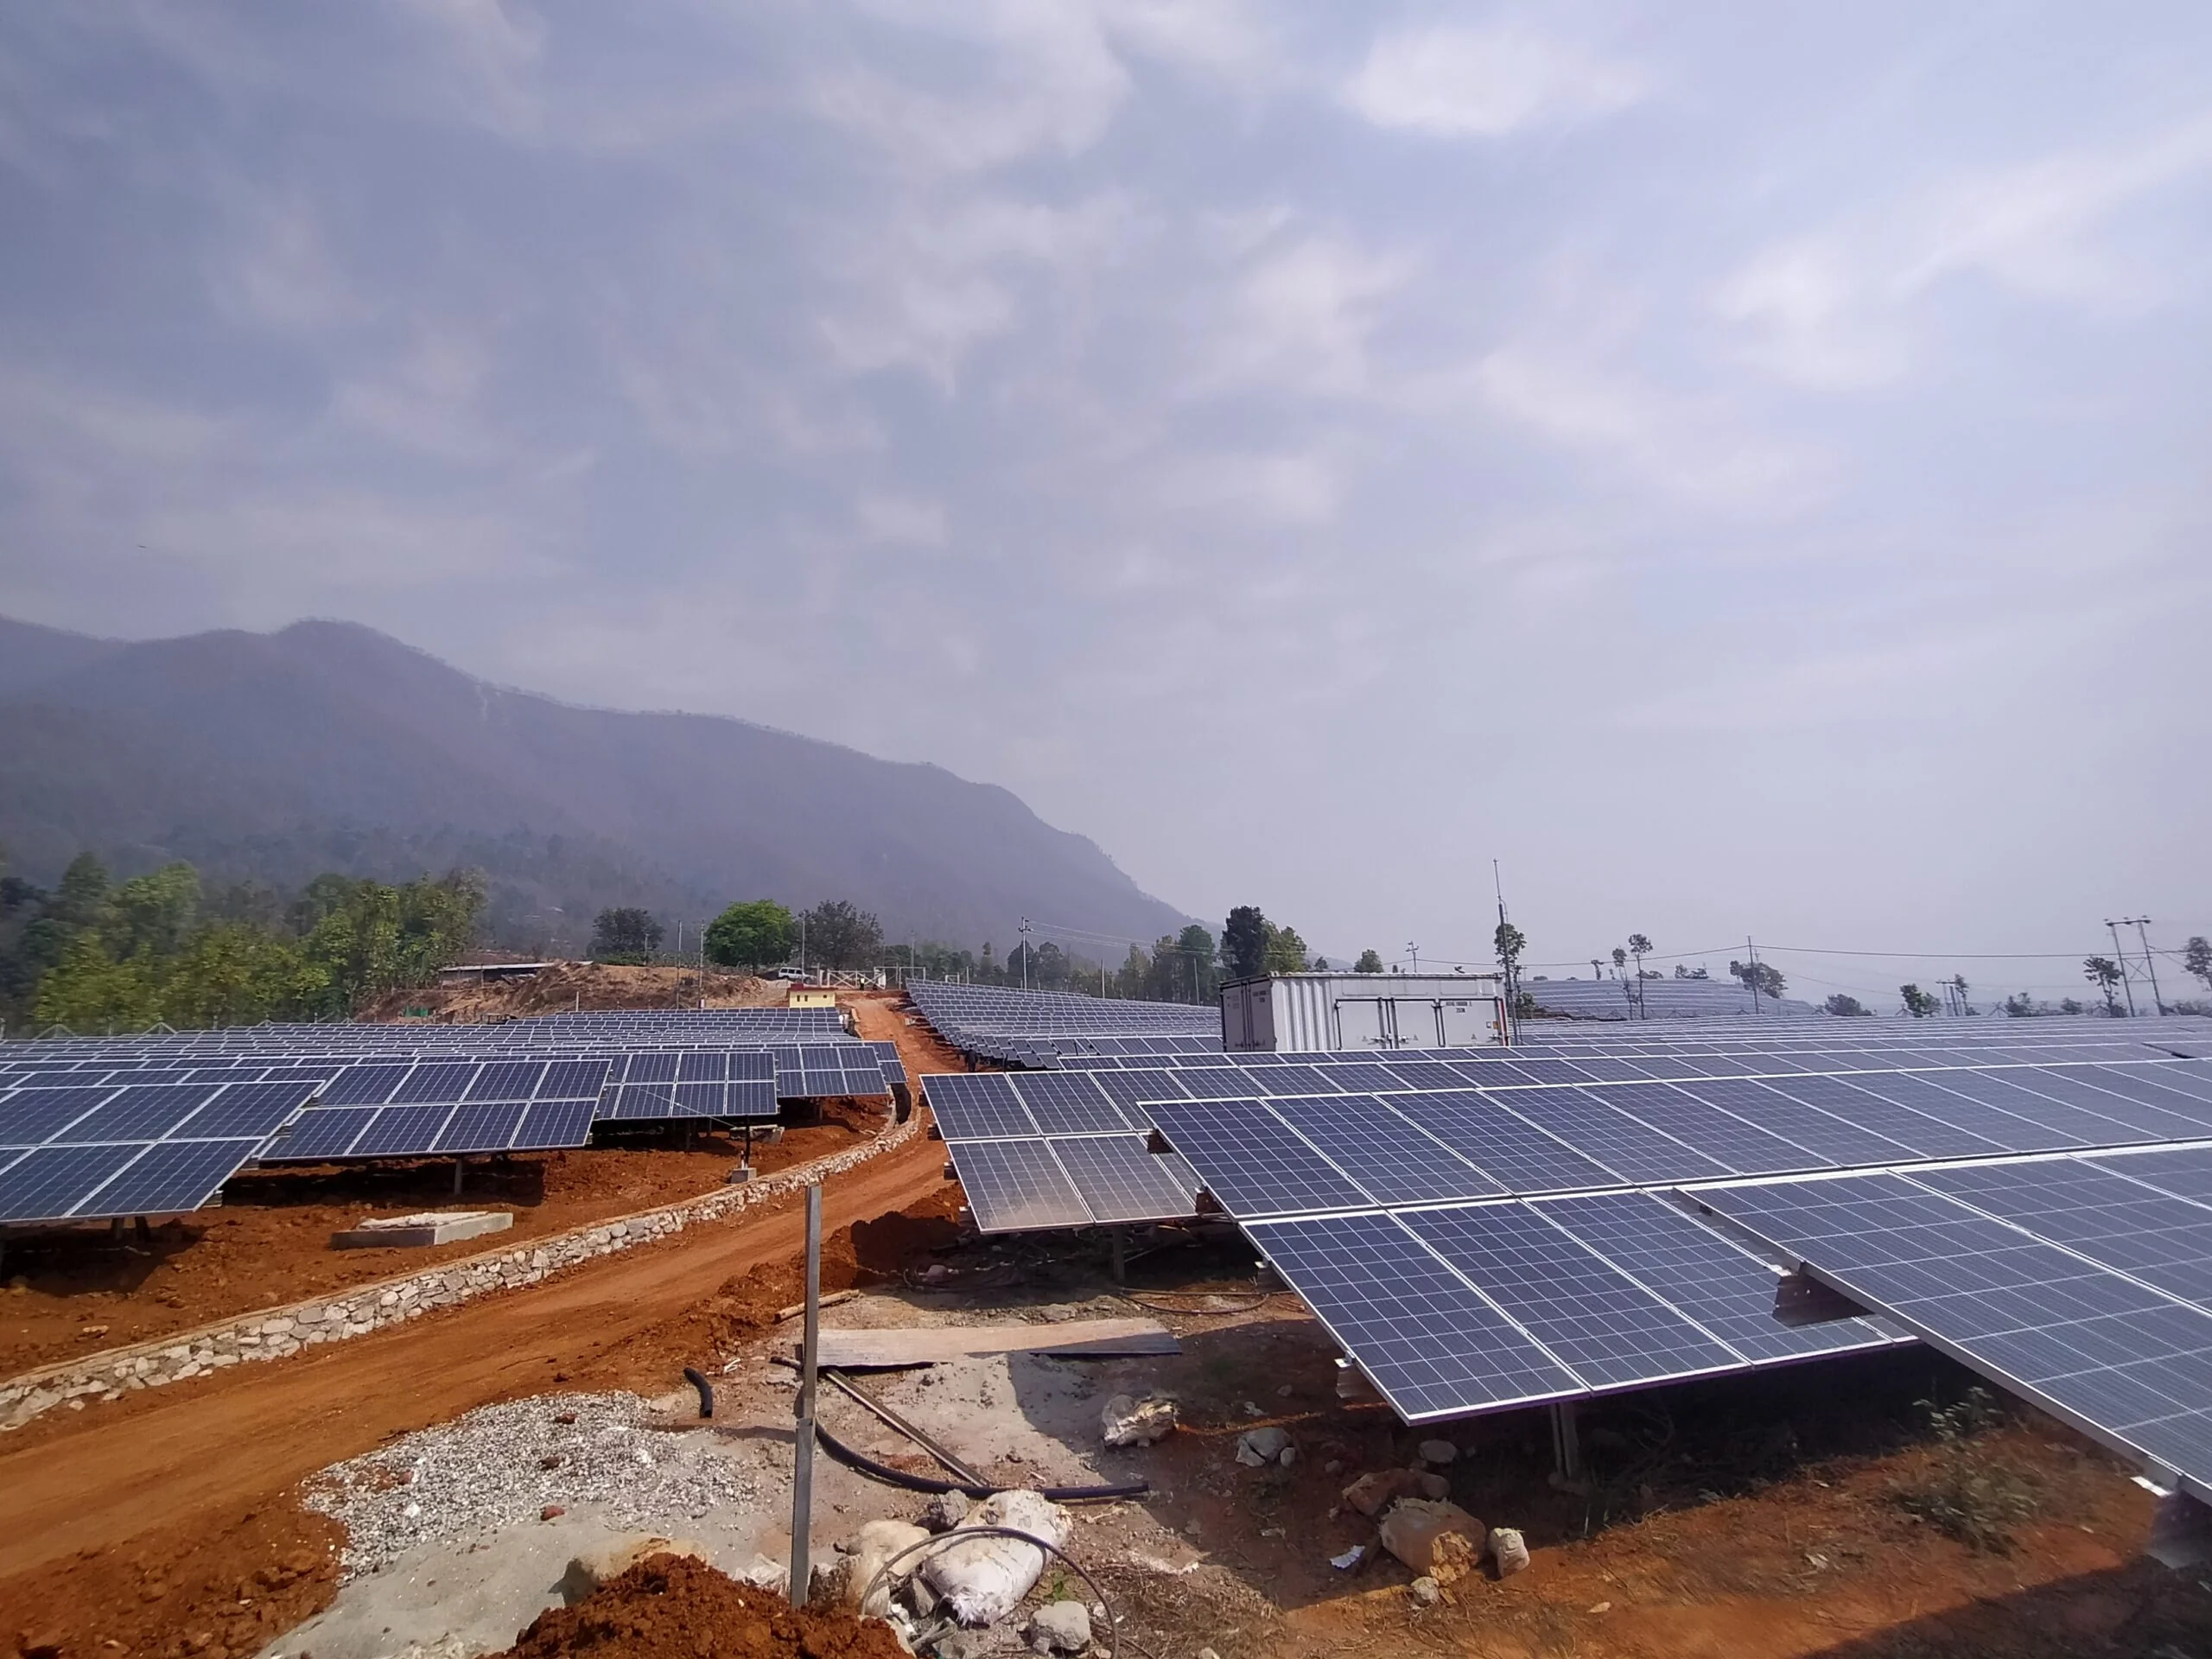
Project Gallery
Outcomes & Learnings
The simulated plant met projected Nuwakot district demand across all seasonal scenarios with N-1 contingency margins intact: removing any single feeder section or inverter block left remaining generation sufficient to supply the minimum load condition without bus voltage violations. The protection coordination study confirmed selective fault isolation — a feeder fault cleared within 0.3 s by the interconnection relay without disturbing the NEA substation bus — consistent with standards for grid-connected distributed generation. Estimated annual energy production from the sized array, after all derating, covered approximately 118% of current district peak demand, providing a modest capacity margin for near-term load growth.
This project was the first in Chandan's academic program to require professional-grade power system simulation software, and it established ETAP fluency that transferred directly to subsequent graduate-level research in power system protection and resilience. The experience of translating raw solar resource and load data into a coordinated protection scheme compressed an engineering workflow that typically spans multiple specialist teams, providing a complete end-to-end view of utility-scale project development.
The Nepal context also sharpened awareness of the constraints that define clean energy deployment in low-income economies: weak grid infrastructure, limited local manufacturing supply chains for inverters and transformers, and the necessity of designing protection systems that remain selective even when operating at the weak end of the national grid. These constraints recur — in different forms — in the data-center and grid-resilience research pursued at MSU, tying undergraduate fieldwork to current research problems.