Load Flow Analysis of Province 1, Nepal
Overview
This project conducted a full load flow analysis of the Province 1 (Koshi Province) distribution network of Nepal using ETAP, the industry-standard power system analysis platform. The study assesses power quality, voltage profiles, and line losses across the distribution system to identify overloaded feeder sections and voltage-deficient buses that pose reliability risks under peak demand conditions.
Nepal's distribution network faces compounding stress factors: rapidly growing residential and commercial load driven by demand that outpaces new generation and transmission investment, aging infrastructure sized for earlier load levels, and a radial feeder topology that concentrates voltage drop on long rural branches. This analysis quantifies the extent of those stresses in the Province 1 system and provides a data-driven foundation for reactive compensation and network reinforcement planning.
Technical Approach
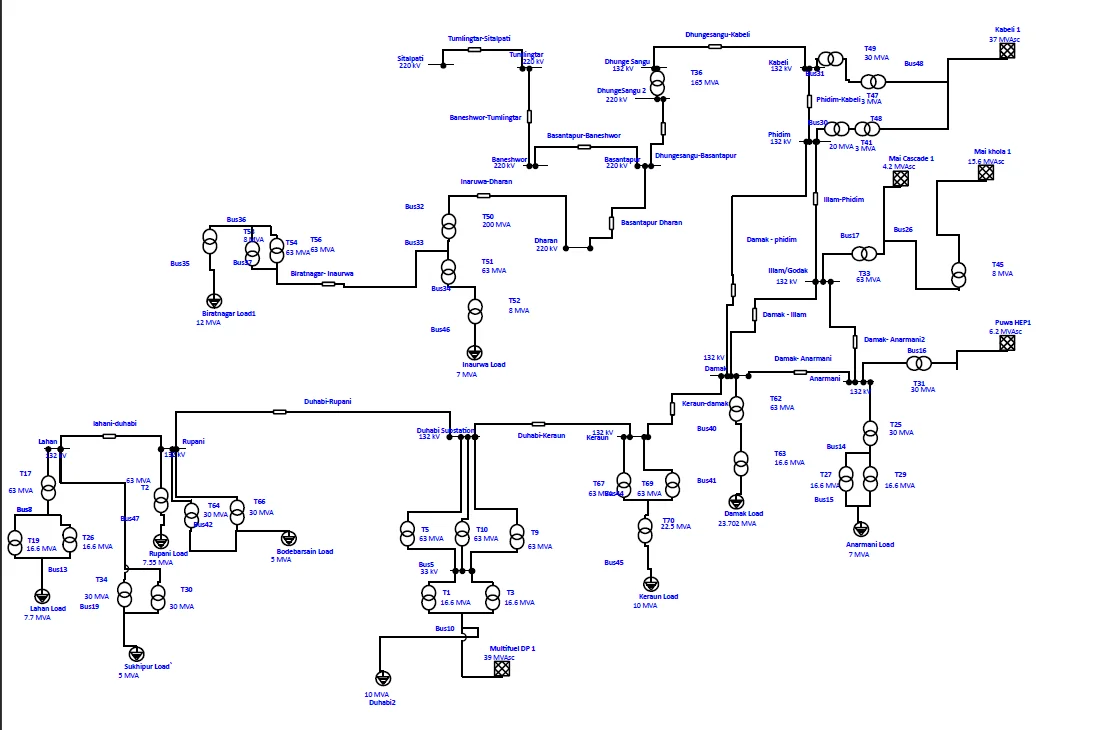
The Province 1 distribution network was modeled in ETAP from single-line diagram data and load survey records obtained from the Nepal Electricity Authority (NEA). Each bus, feeder segment, transformer, and distributed load was entered with its rated parameters — conductor impedance, transformer KVA rating, and load power factor — to construct a model representative of the as-built system.
Newton-Raphson load flow was executed under peak demand conditions, with flat-start initialization and convergence tolerance set to 0.0001 per unit. The Newton-Raphson method was selected over Gauss-Seidel for its superior convergence on the weakly meshed portions of the network. Bus voltages, line loading percentages, active and reactive power flows, and line losses were computed for every element in the network.
Contingency cases then evaluated the impact of N-1 outages — the loss of a single feeder or transformer — on bus voltage and line loading. Each contingency was simulated as a separate ETAP load flow run with the faulted element removed, and the resulting voltage profiles were compared against the 0.95 p.u. lower limit specified by NEA operating standards to identify which outages trigger voltage collapse risk on downstream buses.
Outcomes & Learnings
The base-case analysis identified 14 buses with voltages below 0.95 p.u. under peak load, concentrated on long rural branches in the eastern portions of the Province 1 network where conductor impedance and load distance combine to produce the greatest voltage drop. Three feeder sections registered loading above 90% of thermal capacity, flagging them as near-term overload risks if demand continues at the observed growth rate.
Reactive compensation placement recommendations were derived from the reactive power deficit profiles at the undervoltage buses. Shunt capacitor banks sized to restore bus voltages to within the 0.95–1.05 p.u. acceptable range were identified at six locations, with installed reactive capacity totaling approximately 2.4 MVAR across the six sites. The contingency analysis identified two N-1 scenarios that drove additional buses into undervoltage, pointing to feeder sections where redundant supply paths would most improve reliability.
The work provided hands-on experience with professional-grade power system analysis tools used by NEA engineers, and established a working understanding of the Newton-Raphson algorithm, per-unit system modeling, and contingency screening — competencies that transfer directly to the graduate-level power systems research conducted at MSU.
Project Gallery